Foodbank Hunger Report 2025
Food insecurity can affect anyone. The Foodbank Hunger Report 2025 continues to offer a vital snapshot of our country’s hunger problem.
Read a message from our CEOIn its 13th year of publication, the Foodbank Hunger Report 2025 shows persistent and endemic food insecurity with an unacceptable 1 in 3 (3.5 million) households still facing the distressing question of what, if anything, they will put on their table come their next meal.
It would appear the economic volatility of recent years is not going to ease in the foreseeable future, so it’s concerning we’re not getting any better at protecting the food security of particularly vulnerable Australians. Rather, despite a number of short-term measures, such as one-off payments and rebates, a significant number of households continue to struggle to meet their fundamental needs.
Australia’s housing affordability crisis appears to be supercharging food insecurity in a way we haven’t seen before with nearly 1 in 2 rental households reporting as food insecure. It is entirely unacceptable that people across Australia are facing scenarios where food and shelter have become mutually exclusive.
Overall food insecurity levels have not improved on 2024, with certain groups being observably worse off. Shockingly, nearly 7 in 10 (67%) of households that have a person with a disability or health issue now experience food insecurity, with three quarters of these severely affected. Also alarming is that a similar proportion (68%) of single-parent households are now food insecure.
At the same time, while this year’s Report tells us awareness of food relief services is increasing, it also reflects the fact that too many people still hesitate to seek help. Almost half of food insecure households say embarrassment, stigma or shame prevent them from accessing assistance, while many others believe someone else is in greater need.
The Foodbank Hunger Report 2025 makes it clear that for millions of Australians, the basics of life, food, shelter and security are still far from guaranteed in spite of what we hear about economic improvement. Ultimately, greater investment in food relief, combined with action on the underlying causes of hunger including housing affordability, income inequality, and tax policy, is essential. At Foodbank, we remain committed to working with our communities, partners and governments to achieve an Australia where no one goes hungry.
Kylea Tink
Foodbank Australia CEO
Close panel
“This unfortunately is something that happens quite frequently in our household, almost every week there’s just not enough money to go around. The price of groceries is ridiculous. When my children were young I would average our shopping at roughly $10 per bag of shopping, now I’m lucky if I can get a bag full for $50.”
No reprieve in sight for many on cost-of-living pressures
There is a significant divide between macroeconomic and household recovery.
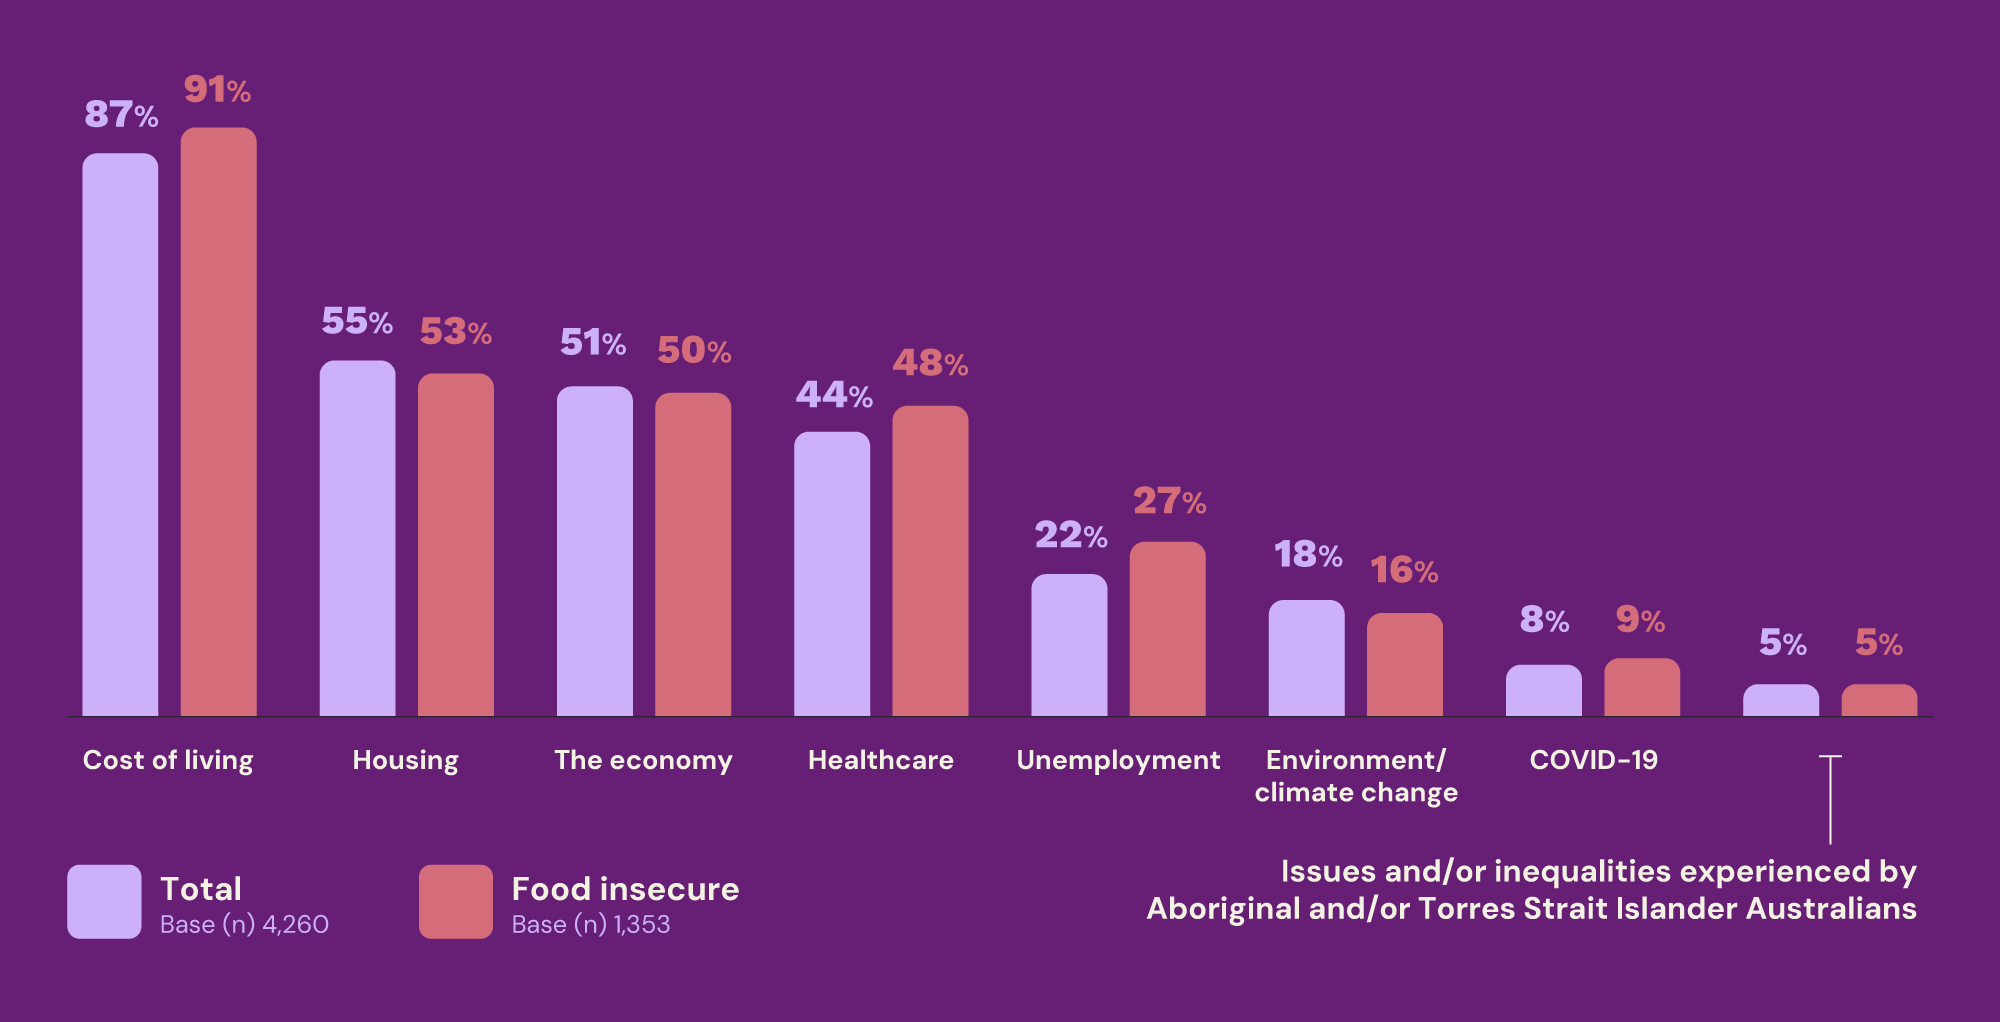
One in three Australian households, nearly 3.5 million, experienced food insecurity in the past 12 months. This is a slight increase on last year’s results (3.4 million households). Despite targeted government efforts such as one-off energy bill subsides, cost-of-living remains the number one concern for 87% of households. This jumps to 91% for food insecure households, who are also increasingly concerned about the cost of healthcare, up 4% on the same time last year.
The most important issues households have been concerned about
This year’s report highlights a significant lag between economic and household-level recovery. Whilst positive signs of economic recovery are being observed at the macro level, the same cannot be said at the household level, particularly for those experiencing severe food insecurity.
Household finances remain under pressure with just 1 in 5 (21%) Australian households reporting that they are living comfortably on their current income, while more than 1 in 3 (36%) are finding it difficult or very difficult to make ends meet.
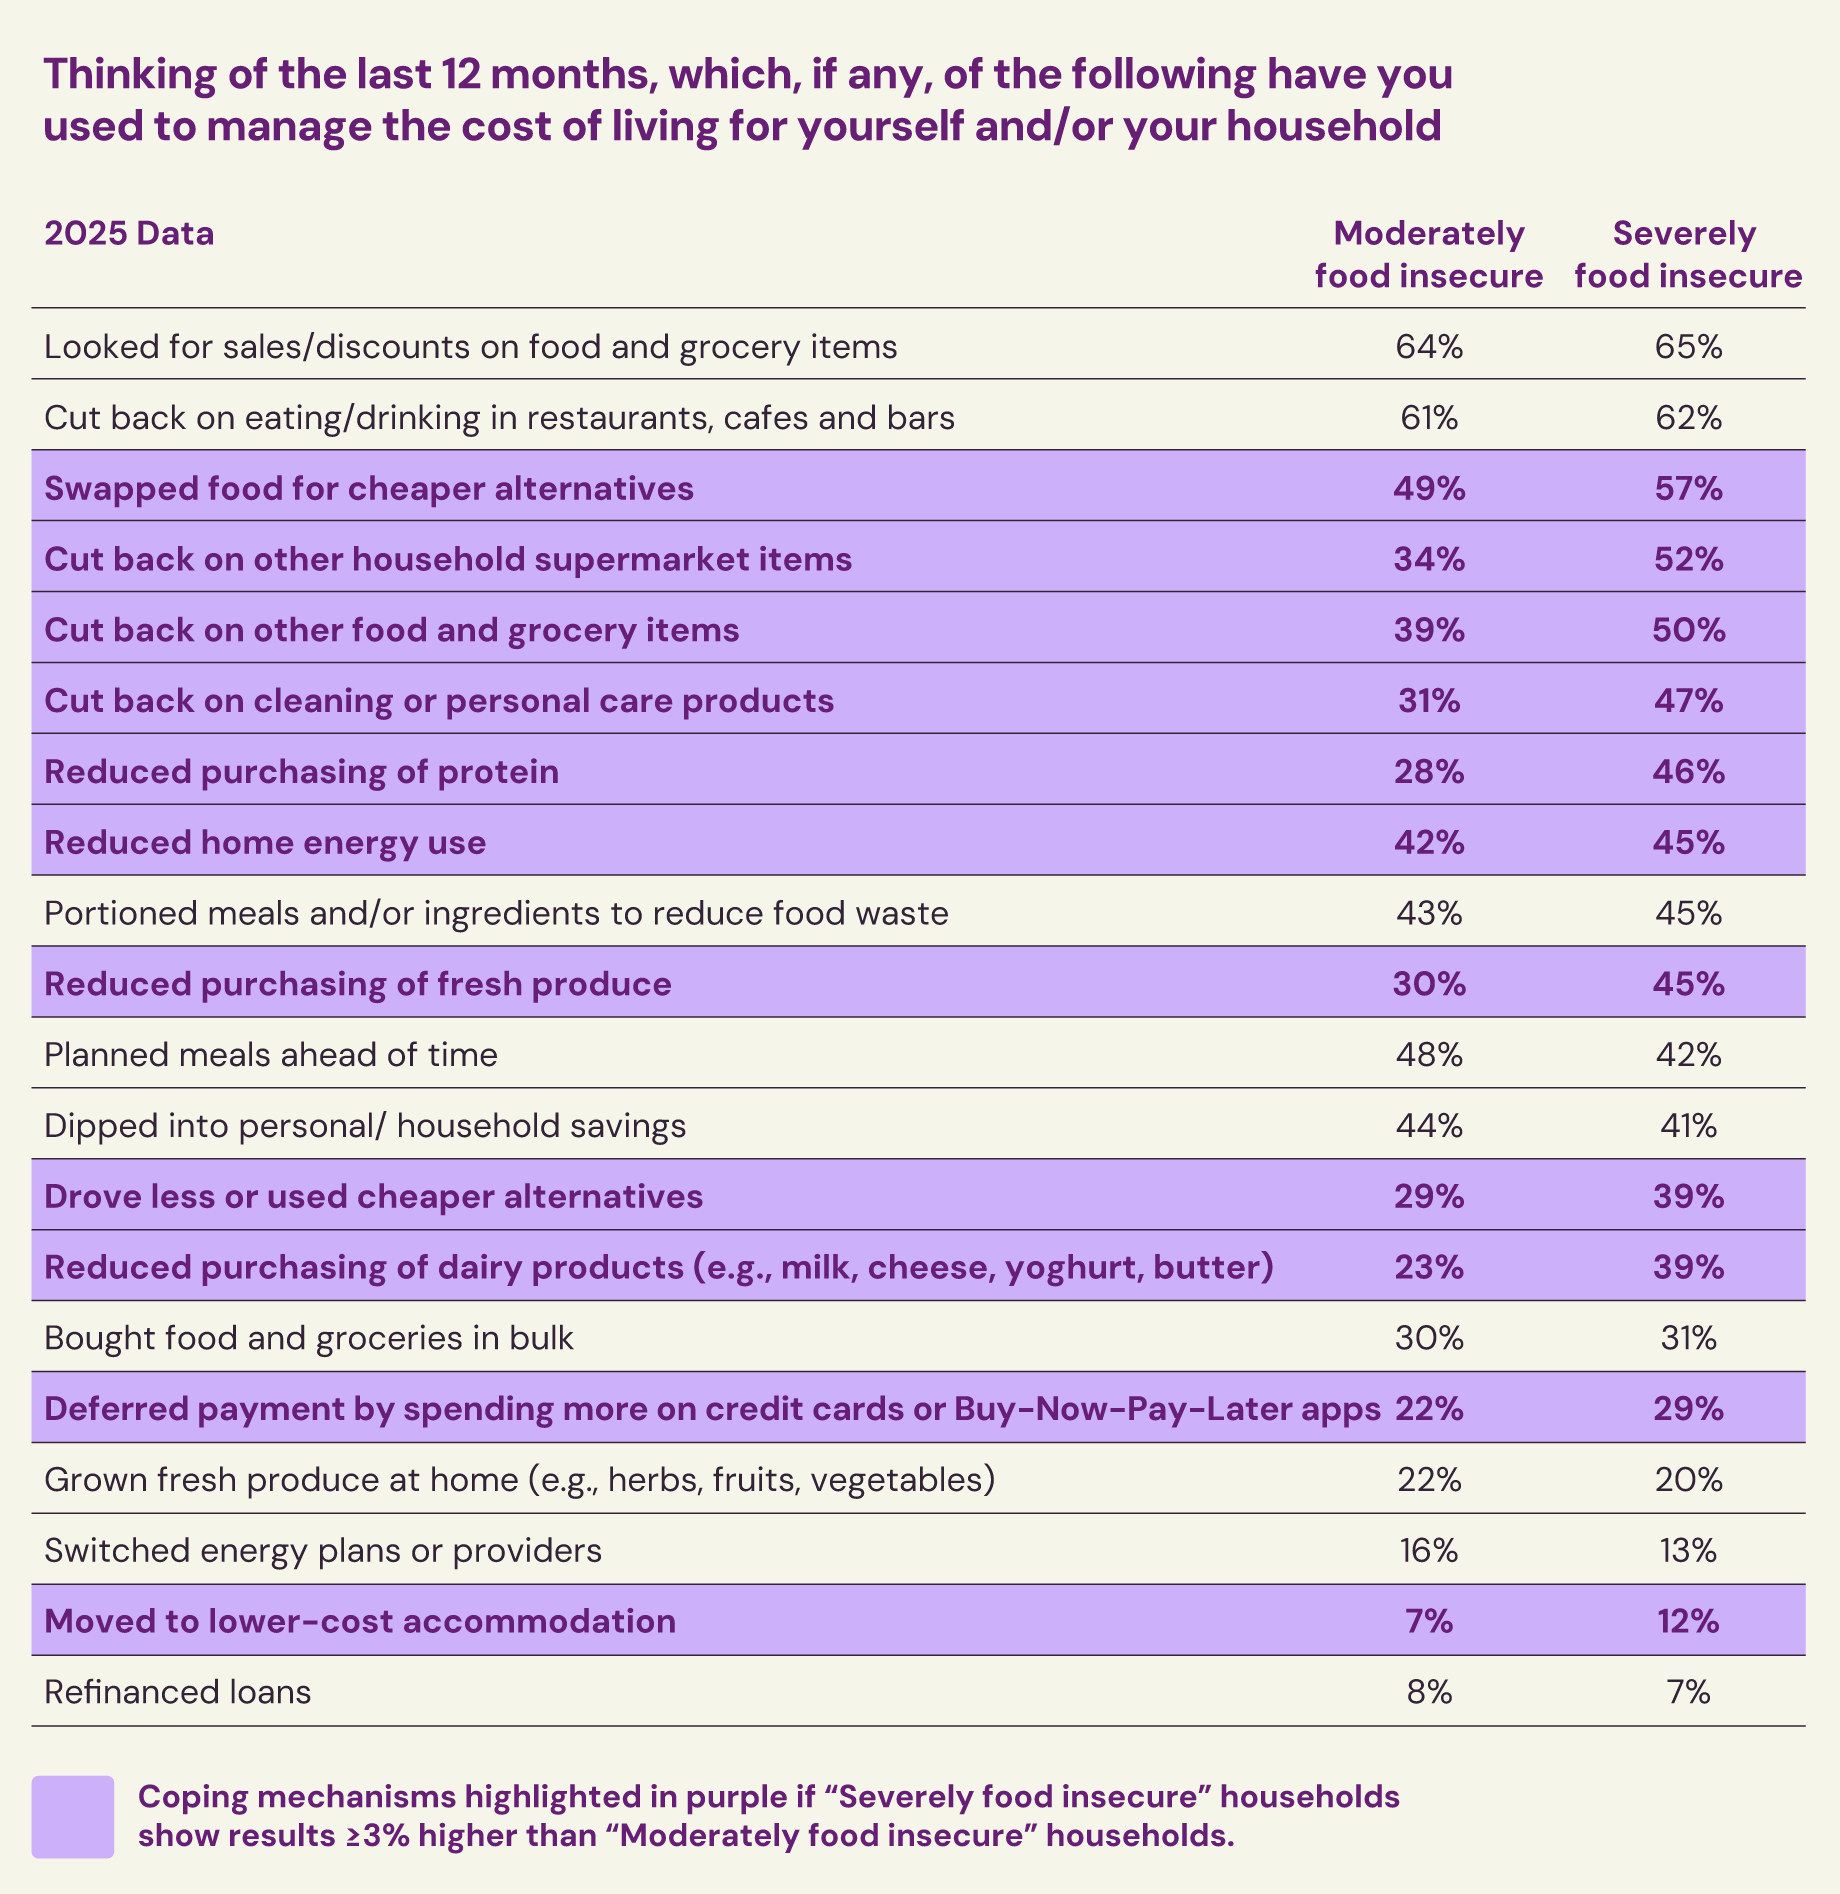
Of particular concern is that 61% of food insecure households are severely affected, meaning they are compromising on nutrition, actively skipping meals or in some cases, going entire days without eating. This has unfortunately not improved in the last 12 months.
The pressure is reshaping household diets. Almost half of severely food insecure households report reducing their purchases of fresh fruit and vegetables, protein, and other essentials. Even among moderately food insecure households, almost one in three have been forced to cut back on the similar core items such as fresh produce in order to cope with rising costs.
“The adults in the home have gone without or with reduced food to ensure we can cover bills and ensure the kids get everything they need. This is due to being out of work since December due to medical reasons, so we are living on a single income.”
Worryingly, many Australians don’t feel confident that things will improve any time soon. Almost half of all households (46%) believe their financial situation will stay the same over the next year, a view held mostly by those already living comfortably. But for households who are already struggling, the outlook is far more worrying. Nearly one in two (49%) households that are currently finding it difficult or very difficult, expect things to get even harder, especially as housing costs continue to climb and eat into already stretched budgets.
Close panel
“I went from living week to week when I was working, then I lost my job because I was asked to look after my grandchildren,
so then I went to government benefits leaving me financially worse off but now having 3 mouths to feed instead of one. I went through my savings well before I even received government benefits because I had to wait 5 weeks before my application was processed and I didn’t qualify for back payment.”
“I try to buy the cheapest food items. I can’t afford meat or fruit and veg, but still, that’s not enough. I still have to pay bills.”
Australia’s housing affordability crisis is supercharging food insecurity
This year’s report paints a bleak picture in the broader context of Australia’s housing crisis, particularly the rental market, where the connection between housing stress and food insecurity has become more pronounced.
2025 saw the average price of residential dwellings pass the $1 million mark 1 , highlighting the nation’s housing affordability crisis. The combination of housing unaffordability and unavailability is impacting food insecurity in Australia in ways never seen before. The rate of food insecurity amongst renters remains high at almost 1 in 2 (48%). There has been a significant increase in households citing “changes in my household/living arrangements” as a reason for their food insecurity (now 29%, up from 25% in 2024). This is partly driven by a notable rise in households that have had to move residence numerous times in the past year.
For single-parent families – one of the hardest hit groups – the situation has become even tougher. Many point to changes in their housing or living arrangements, like moving house or rising rent, as a key reason they’re struggling more than the average food insecure household.
For the nearly one-in-three (30%) Australian households who rent, the housing climate over the past few years presents a landscape of unrelenting financial strain.
For households experiencing food insecurity, keeping a roof over their heads has to come first. They know that falling behind on rent or mortgage payments has far more serious long-term consequences than cutting back on food.
Close panel

“It’s the same once a month. Rent is too expensive. I just manage to pay rent then it’s that part of the cycle where I am going to be short of money for something such as food.”
“Chose to pay rent and bills instead of buying food or put food onto buy-now-pay-later.”
Food insecurity highlights growing inequality
Overall food insecurity levels are not improving and the predicament for certain vulnerable sectors of the community is only getting worse.
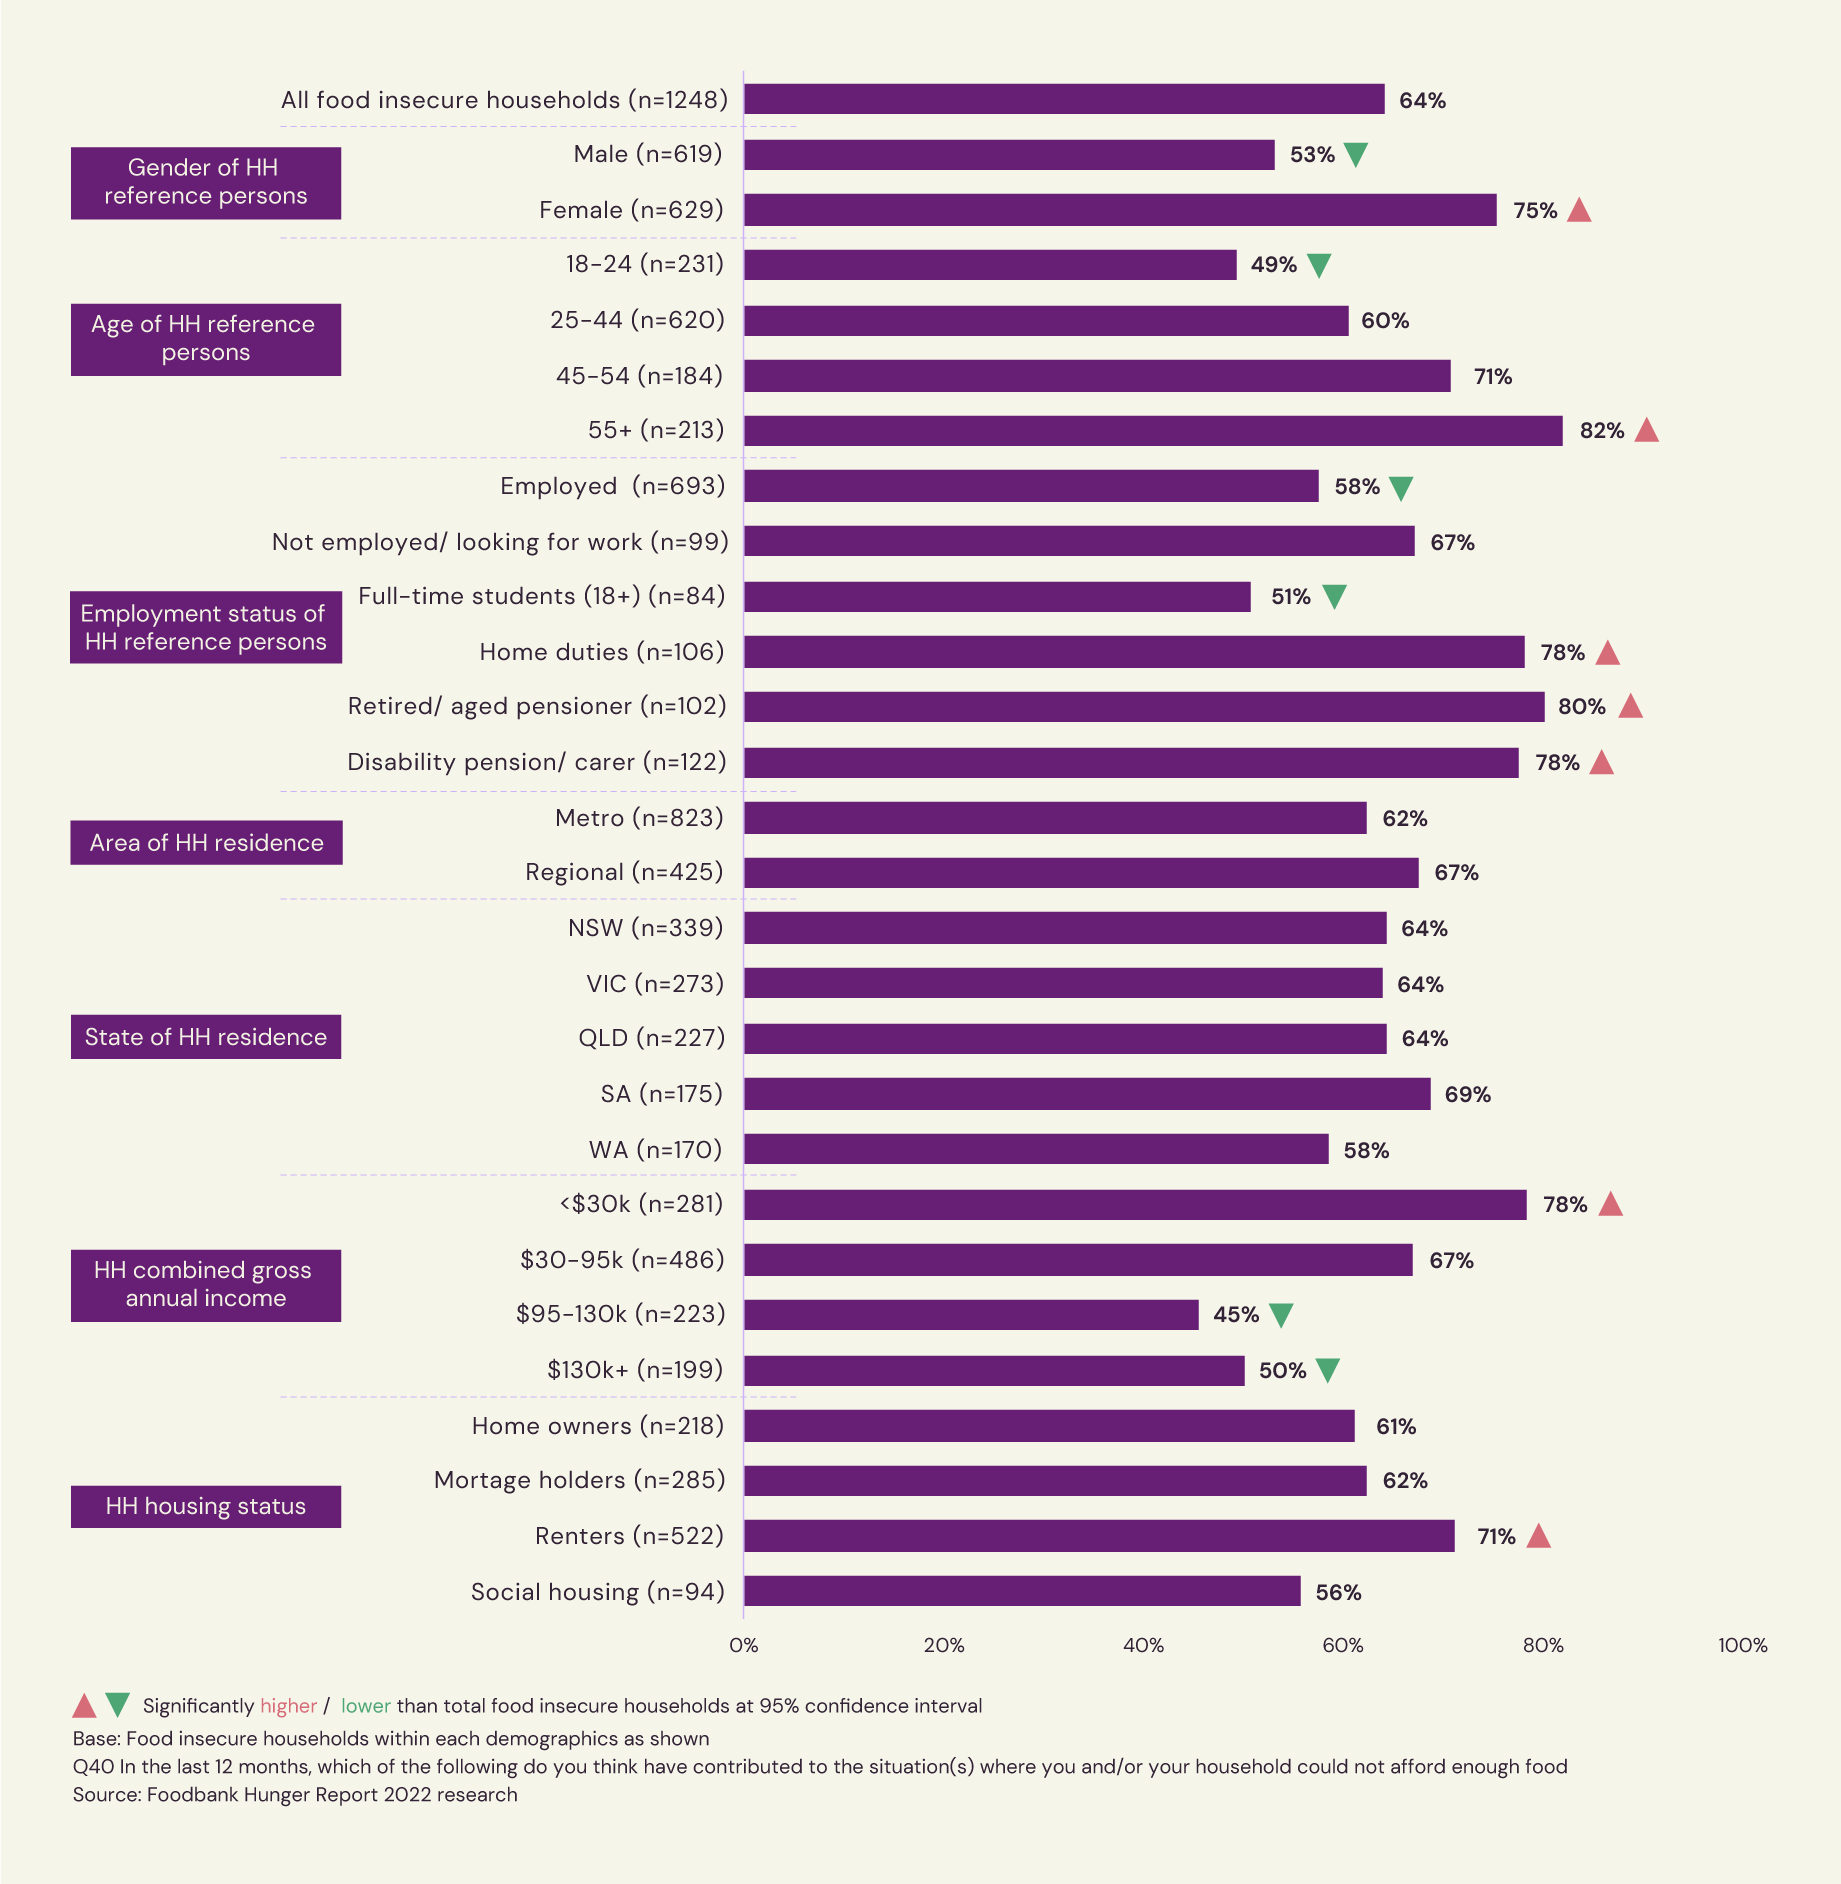
Nearly 7 in 10 (67%) households that include a person with a disability or health issue now experience food insecurity, with three quarters of those in the severe category. These households are significantly more likely than other food insecure households to cite the following as contributing factors:
- Increased/high living expenses (e.g. for food and housing);
- reduced or low income and/or government funding; and/or
- limited access or the ability to travel and get food.
These results suggest that households including people with a disability and/or health issues are suffering the consequences of compounding issues of housing unaffordability, insufficient income or income support, and food accessibility.
“We need private health insurance because of my husband’s medical issues. His health comes first and we can’t wait years for public hospitals. The trade-off is compromising on food and other essentials like warming our home.”
Low-income households (earning at, or under $33,799 p.a.) continue to struggle, with more than two-thirds (69%) experiencing severe food insecurity.
Households with part-time or casual workers facing food insecurity jumped from 36% in 2024 to 40% in 2025. This is particularly concerning because non-permanent or inconsistent work makes it difficult for households to budget and plan, leaving them more vulnerable or exposed financially.
When it comes to income brackets and who is affected, there has been a sharp increase in the proportion of households earning $33,800 – $90,999 p.a. experiencing food insecurity, now 37%, compared to 31% only three years ago.
Even households earning $91,000 or more p.a. are not immune, with one in five food insecure, showing no improvement in the last 12 months.
Single-parent households remain one of the most ‘at-risk groups’, with 7 in 10 (68%) now food insecure. This group attributes this more to changes in household or living arrangements than the average food insecure household.
Close panel
“In the past few weeks, we have had to help supplement my mother’s income/meals because she had been waiting over 18 months for her disability support pension review, and she has many health issues…
and she can’t care for herself and job seeker is not enough for her to live on, so we have to take on that burden. On top of that the endless rent increases are so crushingly brutal.”
Greater awareness of food relief, but stigma keeps people from reaching out
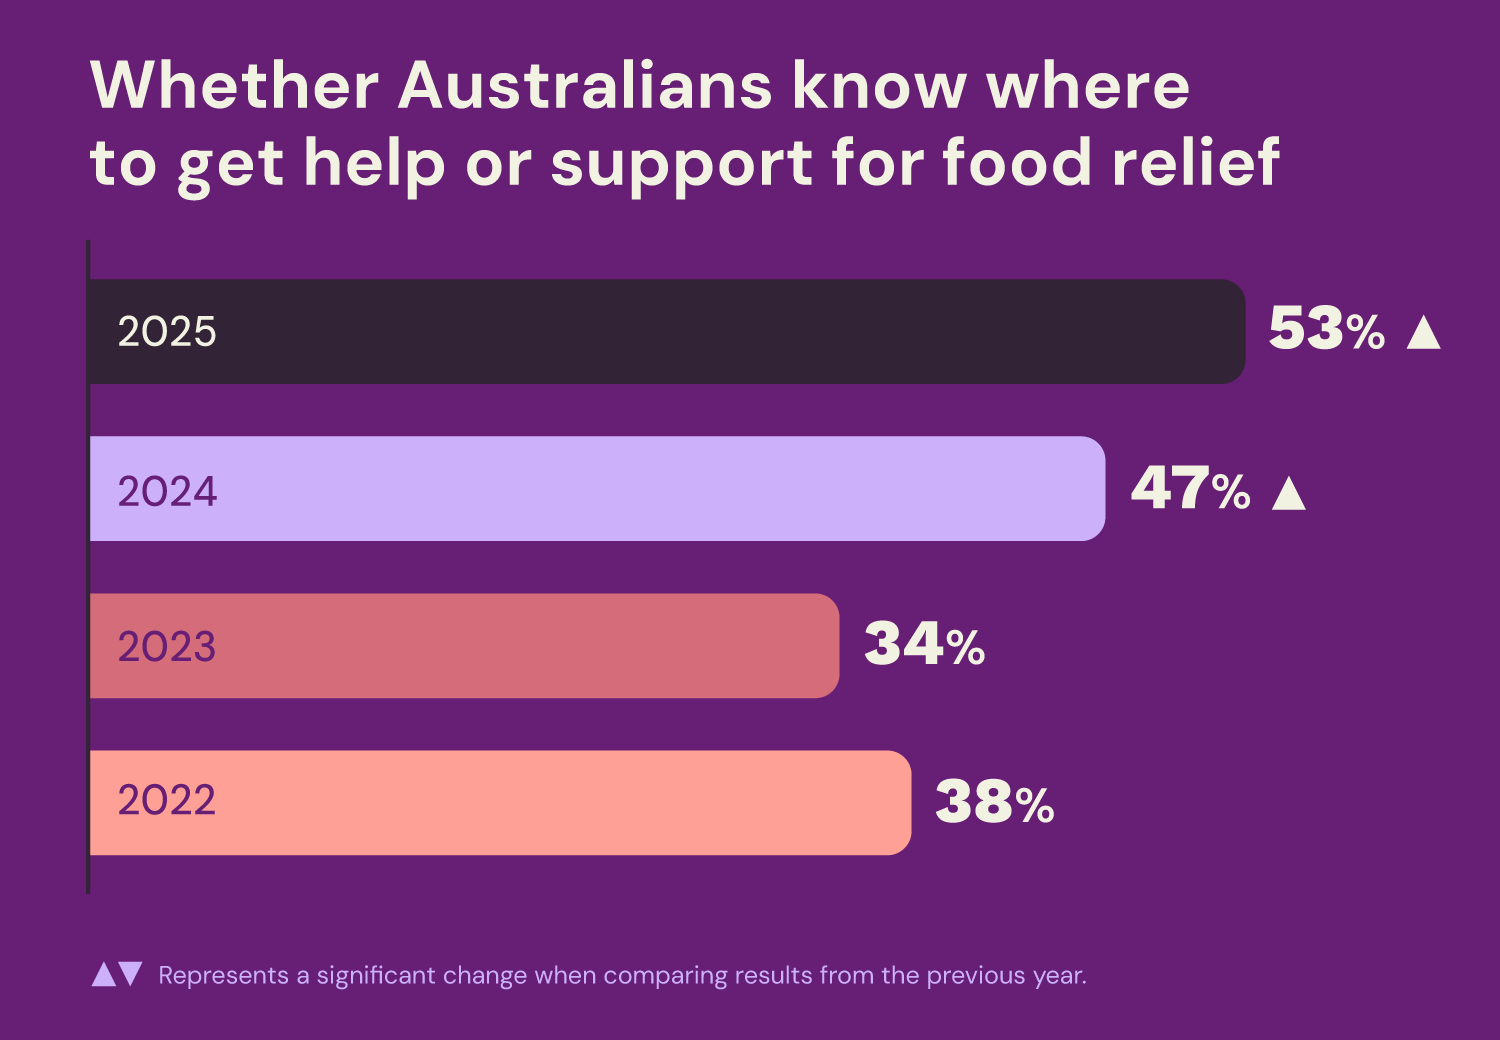
Whilst more Australians know where to find help, shame and uncertainty are preventing many from accessing vital support.
There has been positive progress when it comes to community awareness of food relief. More households now know where to turn if they can’t afford enough to eat, with awareness reaching a record 53% this year, a big jump from just 34% in 2023.
However, knowing where to get help doesn’t always mean people access it. 43% of households experiencing food insecurity have ever used formal food relief, and just 1 in 4 (25%) did so in the past year, similar to in 2024. Despite growing awareness and efforts to reduce stigma, many people still hold back due to a sense of shame or stigma attached. Almost half (45%) feel embarrassed or ashamed to ask for help, while 35% worry that others are in greater need. A lack of clarity around eligibility or how to access support is another barrier, leaving too many households going without the assistance they need.
Close panel
“There are people far worse off, I would feel bad taking food.”
Methodology
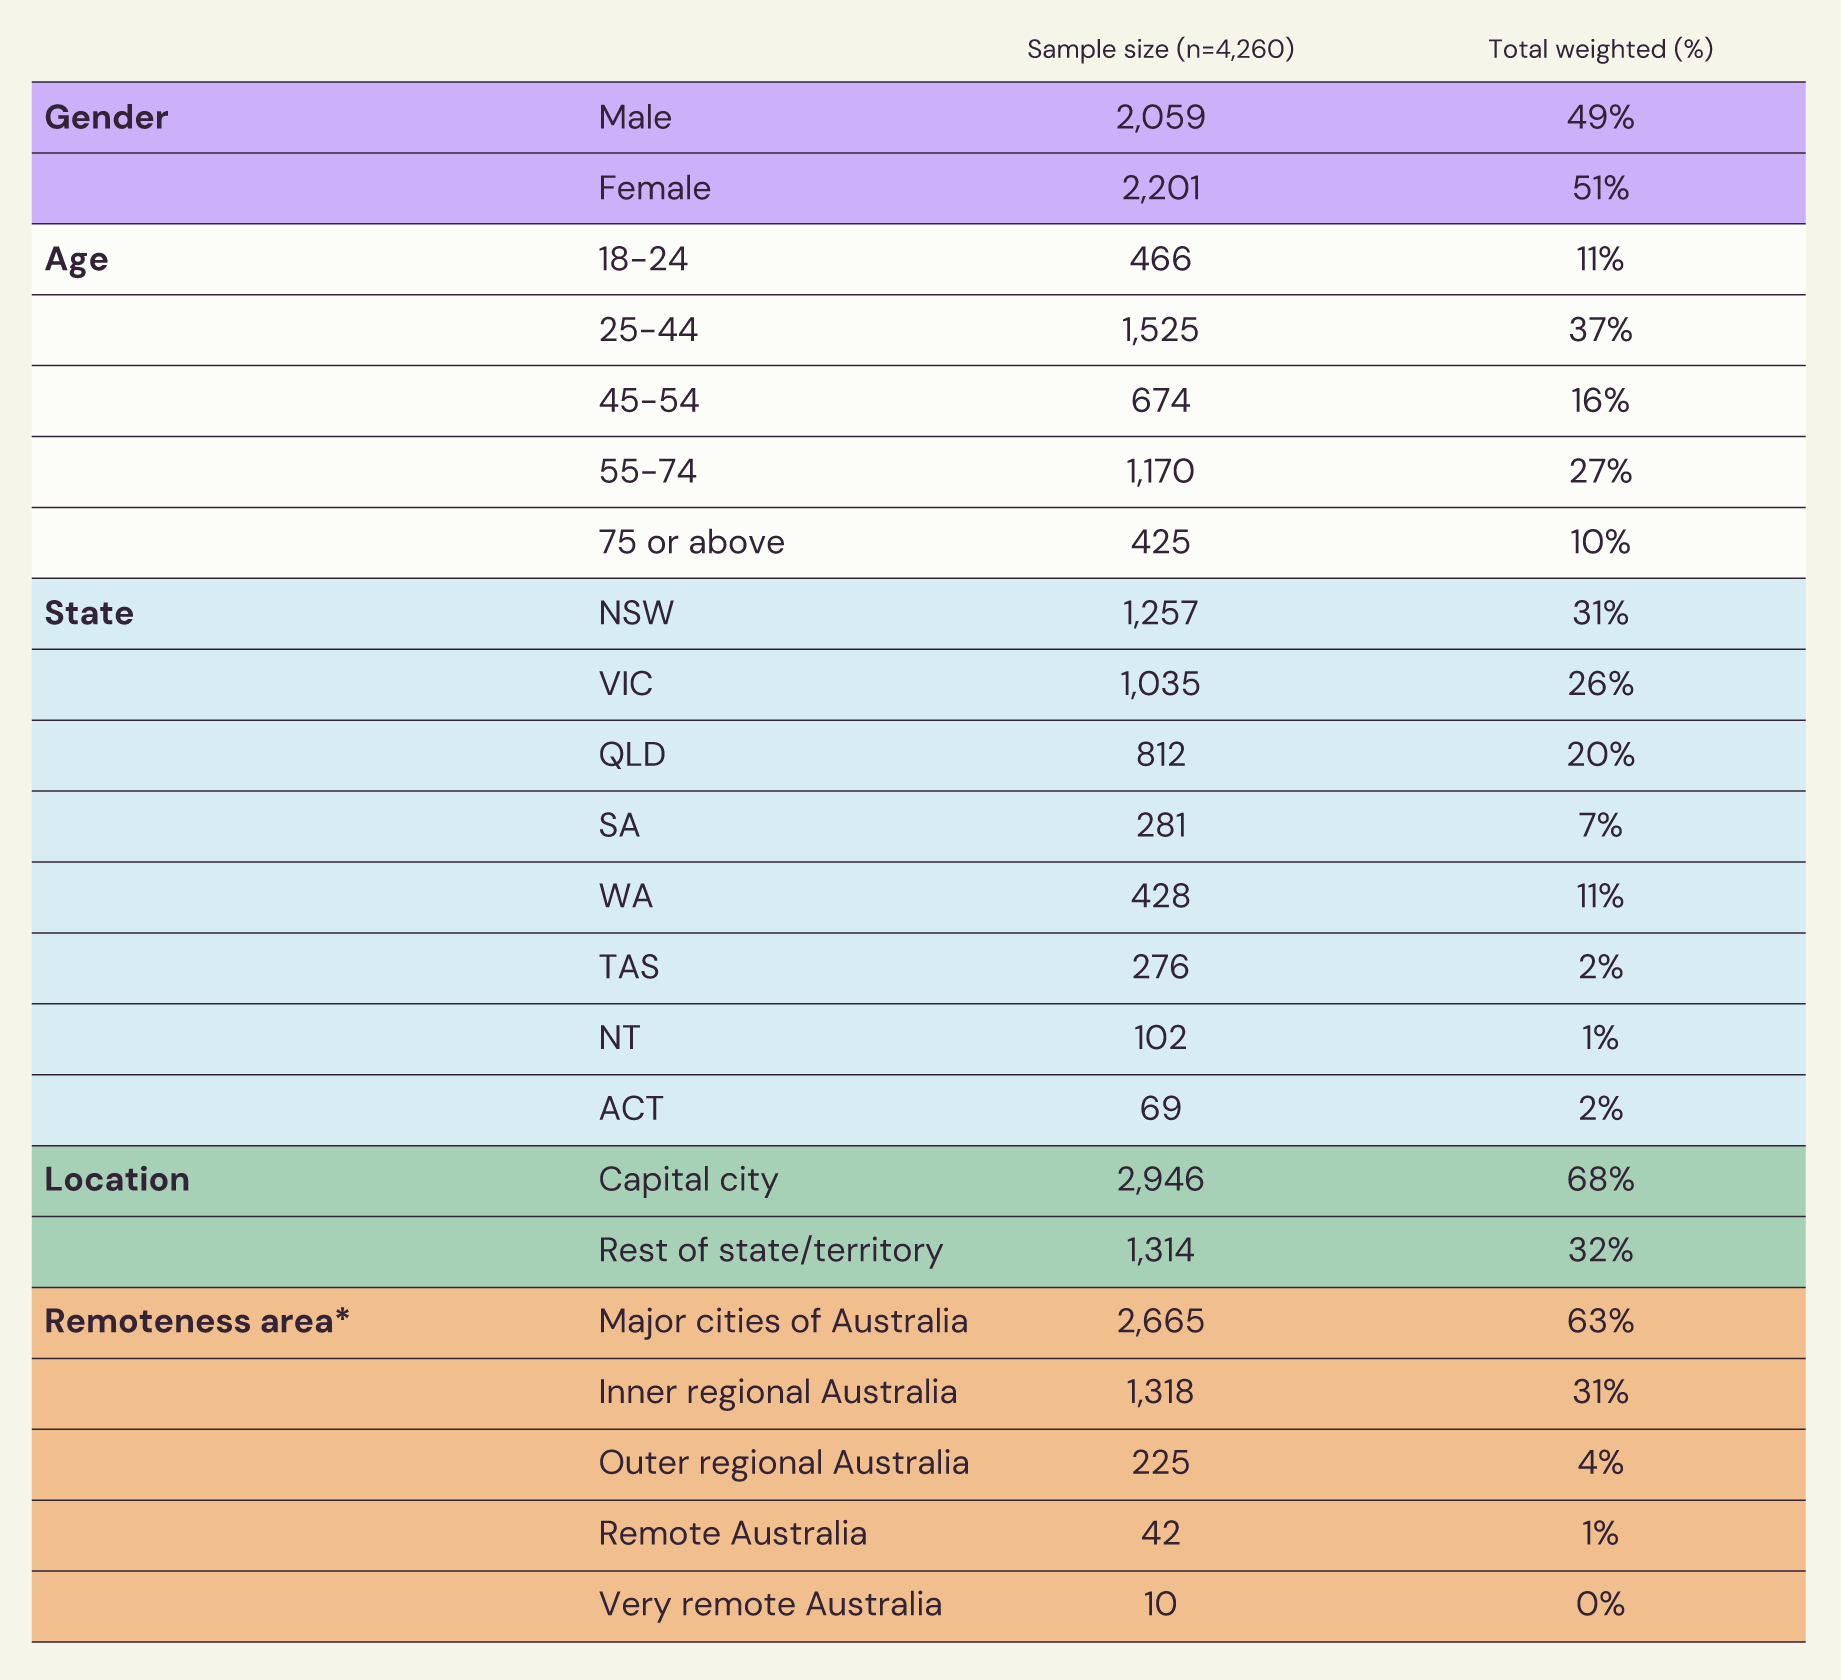
Read the details hereThe Foodbank Hunger Report 2025 research was conducted between 24th June – 17th July 2025, through an online survey of 4,260 Australians aged 18 years or older (main sample) and a booster of 260 Australians 18+ from NT (n=102) and TAS (n=276). The main sample was nationally representative with interlocking quotas by age, gender and location.
The data was weighted to nationally representative proportion of age, gender, state and location as summarised in Table 1 below.
All 4,260 Australians answered the core HFSSM for measurement of the prevalence of household food security over the past 12 months. A total of 1,353 respondents (33%) were identified through the HFSSM as being from moderately and severely food insecure households. This group continued to answer a deep dive module about their experience living with food insecurity over the last 12 months.
Close panel
Frequently Asked Questions
Learn more about the reportThe Foodbank Hunger Report 2025 research was conducted between 24th June – 17th July 2025, through an online survey of 4,260 Australians aged 18 years or older (main sample) and a booster of 260 Australians 18+ from NT (n=102) and TAS (n=276). The main sample was nationally representative with interlocking quotas by age, gender and location.
General Overview
About the Foodbank Hunger Report
The USDA defines food security in four levels based on responses to the HFSSM.
| Status | Level of impact | Label as per HFSSM | Definition |
|---|---|---|---|
| Food Secure | Highly food secure | High food security | No reported indications of food-access problems or limitations. |
| Marginally food secure | Marginal food security | One or two reported indications—typically of anxiety over food sufficiency or shortage of food in the house. Little or no indication of changes in diets or food intake. | |
| Food Insecure | Moderately food insecure | Low food security | Reports of reduced quality, variety or desirability of diet. Little or no indication of reduced food intake. |
| Severely food insecure | Very low food security | Reports of multiple indications of disrupted eating patterns and reduced food intake. |
- Survey mode
- Survey length
- Sampling methods
- The specific HFSSM module used
- The classification rules for food insecurity used
Close panel
Foodbank Australia would like to thank the following, without whom the Foodbank Hunger Report would not be possible:
The individuals who shared their lived experience in the Foodbank Hunger Report Survey, providing insights into the challenges they face in meeting their daily food needs. Please note all images associated with quotes are stock photos.
The hard-working state and territory Foodbanks who are always prepared to take time from their vital work to respond to our requests for feedback and on-the-ground intelligence and observations.
IPSOS for undertaking the Foodbank Hunger Report Survey and providing detailed analysis of this and other sources of data to provide the basis for this report.
Russell Moverley for the design of the report.
TBST Digital for the development of the report website.
The Australian Government Department of Agriculture, Water and Environments’ financial contribution via the End Food Waste Australia project: Enhancing Foodbank’s stakeholder engagement.
This report may be quoted for the purposes of research, discussion, record keeping, educational use and other public benefit, provided that such reproduction acknowledges Foodbank Australia.
Foodbank Australia Limited
ABN 58 073 579 254 +61 2 9887 4144 research@foodbank.org.aufoodbank.org.au
Facebook: https://www.facebook.com/FoodbankAus
Twitter: https://twitter.com/FoodbankAus
LinkedIn: https://au.linkedin.com/company/foodbank-australia
Instagram: https://www.instagram.com/foodbankaus
YouTube: https://www.youtube.com/user/FoodbankAustralia
Close panel