Foodbank Hunger Report 2026
We call Australia the lucky country. Yet the Foodbank Hunger Report™ 2026 confronts us with a reality no prosperous nation should accept: that hunger has become a defining feature of life for far too many households.
Read a message from our CEO
Show more…Concerningly, this year’s Hunger Report found one in three households, or the equivalent to 3.6 million homes across the country, experienced food insecurity in the past 12 months. Behind this figure are parents skipping meals so their children can eat, renters choosing between groceries and medication, and people in regional areas choosing fuel over food. Quite simply the wages of working families no longer stretch far enough to cover the essentials.
Disturbingly, the data indicates food insecurity is no longer a temporary consequence of economic disruption. Food insecurity has become entrenched. While the national rate remained stable at one in three households, in truth this represented a real increase because the total number of households in Australia grew. In 2025, 3.5 million households experienced food insecurity; in 2026, the figure rose to 3.6 million, meaning that approximately 100,000 more households were affected.
In this context, stability must not be mistaken for success.
Persistent hardship now affects millions of households not typically considered to be living on the margins. This is a profound social and economic failure.
With that said, the overarching burden continues to fall disproportionately on those least able to absorb it: renters, low-income households, single-parent families, people living in regional areas, households affected by disability or ill health, younger Australians and First Nations communities.
The drivers of food insecurity are clear. Rising food, housing, fuel and energy costs, combined with broader cost-of-living pressures, continue to place extraordinary strain on household budgets. Employment challenges are further compounding hardship with increasing numbers of Australians reporting difficulty finding work or experiencing job losses.
As pressure mounts, households are making sacrifices that extend far beyond food. People are reducing energy use, cancelling social activities, cutting back on personal care and withdrawing from community life to put food on the table.
Hunger is not just about empty cupboards. It impacts health, education, workforce participation, mental wellbeing and social connection.
Perhaps most concerning is the growing sense of pessimism. More Australians believe their financial situation will worsen in the year ahead rather than improve. For many households, there is little confidence that relief is on the horizon.
Yet there are reasons for optimism. This report demonstrates that targeted interventions work. School Breakfast Programs are reaching more children than ever before, reducing barriers to participation and ensuring students can begin the day nourished, focused and ready to learn. Where support is available, families use it. Where investment is made, outcomes improve.
The findings of this year’s Foodbank Hunger Report™ demand more than concern: they demand leadership and action. The challenge before us is not whether we know what works, but whether we are prepared to act at the scale required.
Food relief organisations cannot solve this crisis alone.
Government, businesses, philanthropists and communities all have a role to play. Together, we must invest in immediate relief while addressing the structural causes of food insecurity.
In a nation as prosperous as Australia, nobody should wonder where their next meal will come from. The findings in this report demand more than concern.
They demand action.
Kylea Tink
Foodbank Australia CEO

A nation
under pressure
This year’s report shows Australia’s food crisis has become a persistent reality for millions of households. In 2026, 3.6 million households experienced food insecurity, continuing a troubling pattern that has remained unacceptably high since tracking began. Behind these figures are families making impossible choices between paying rent or energy bills and putting food on the table.
When one in three households cannot consistently access enough nutritious and culturally appropriate food, hunger can no longer be viewed as an issue affecting only a small group of vulnerable Australians. It has become a national challenge requiring a national response.
Number of food insecure households over the last 5 years
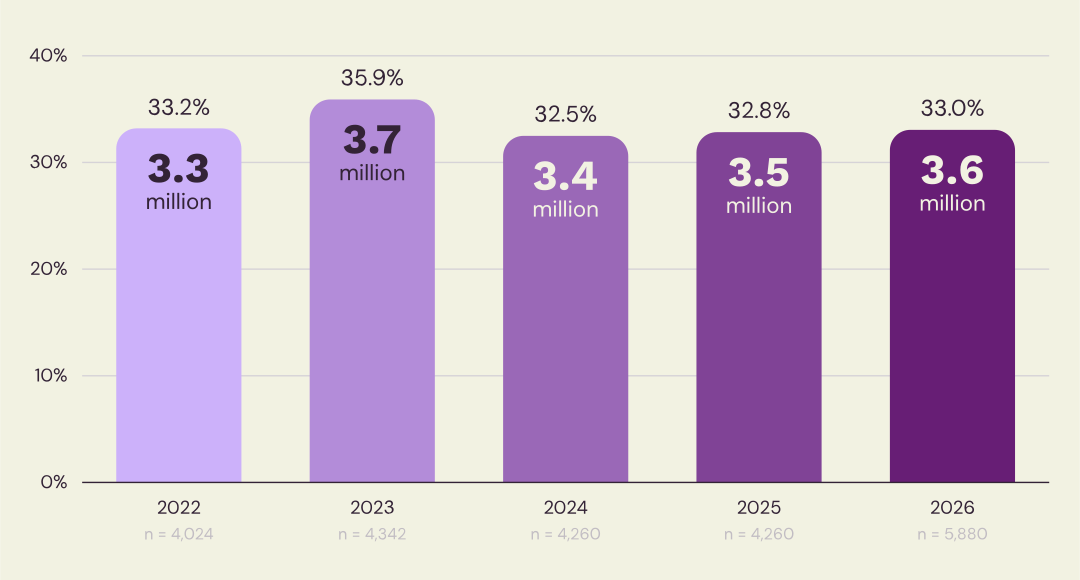
Total sample. Weight: Final_hhld_wt. Base n = 22,766; effective sample size = 15,470 (68%).
What is driving insecurity?
Show more…The cost-of-living crisis is driving food insecurity
For the overwhelming majority of food insecure households, the cause is clear. Rising living costs continue to place extraordinary pressure on household budgets, with 92% of food insecure households identifying the cost-of-living as a top concern over the last 12 months. Food prices remain elevated, housing costs continue to increase, fuel costs are on the rise, and utility bills consume a greater share of the household budget. Even small financial shocks can push households into crisis. What was once financial stress is increasingly becoming food insecurity.
Financial pessimism is at its peak
Food insecurity is not only changing how Australians live; it is also reshaping how they view the future. More than one-third (35%) of Australians expect their financial situation to deteriorate over the next 12 months. Expectations about the future are closely linked to households’ current financial circumstances, with pessimism greatest among those already under pressure. Unsurprisingly, confidence declines as financial pressure intensifies. Half of households struggling to manage on their current income expect their circumstances to worsen (50%), rising significantly to 61% among those finding it very difficult to get by.
Australian household financial circumstances
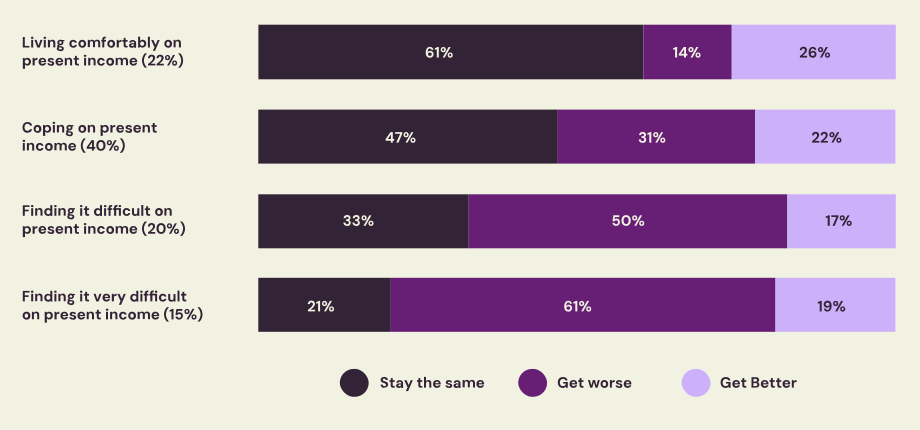
F1. Which of these descriptions comes closest to how you feel about your household’s income nowadays?
F2. Do you think your household financial circumstances will get better, worse or stay the same over the next year? Base: [Total] 2026 n = 5,880
Due to rounding, figures may not add up to 100%
This pessimistic outlook is reflected in broader economic indicators. The Australian Bureau of Statistics reported that living costs increased by between 3.7% and 4.7% across household types in the year to the June 2026 quarter, with age pensioner households experiencing the largest rise. Over the year to July 2026, consumer prices increased by 3.5%, driven primarily by housing costs (5.0%) and food and non-alcoholic beverages (3.2%). Consumer confidence also weakened, with the Westpac–Melbourne Institute Consumer Sentiment Index falling 5.2% to 84.4 in September, returning towards deeply pessimistic territory as higher fuel prices and concerns about further interest rate increases placed additional pressure on household budgets.
This growing pessimism reflects a wider reality – many households can no longer see a path back to financial stability.
3.6 million hungry households would
make a line from Perth to Sydney
Hunger does not affect everyone equally
Beneath Australia’s overall food insecurity rate lies a widening divide between households with resources and those without. Where people live, how they are housed, whether they are healthy and the income available to them, all determine whether they can afford enough food.
Only 12% of households that own their home outright experience food insecurity. Among renters that figure rises to 51%.
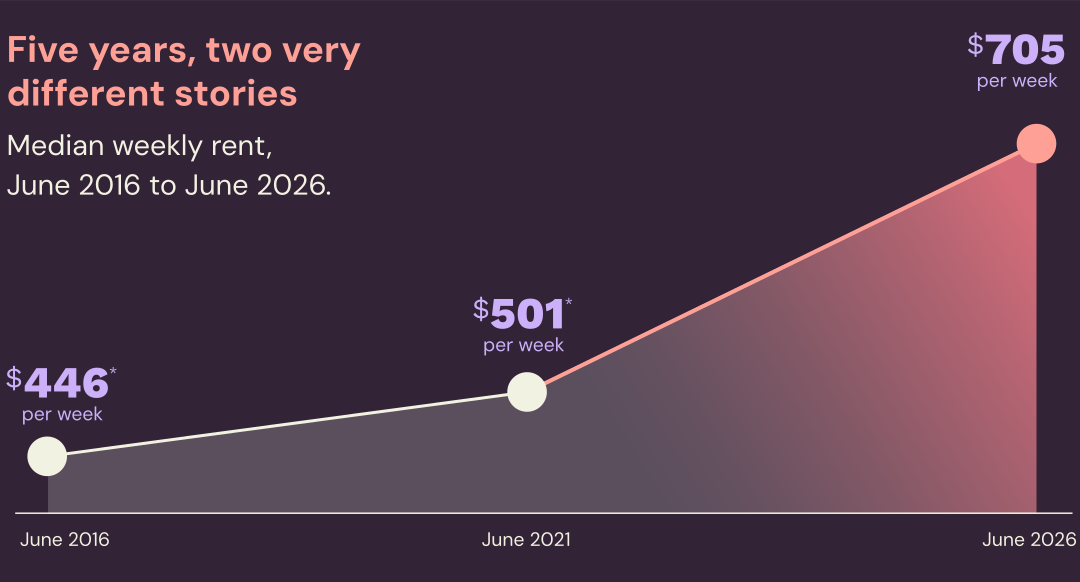
National rents have increased 40.6% over the past five years due to the sustained cumulative increases. Renters are paying an additional $204 per week in rent.
The previous five-year period (June 2016 to June 2021) only saw median rents rise by $55 per week, or 12.2%.
Who is it affecting the most?
Show more…Among households earning less than $33,799 annually, more than half reported experiencing food insecurity (53%), with more than one in three (37%) of these reporting they experience severe food insecurity. This is the highest level recorded for this group since data collection began, reflecting a worsening trend for low-income households.
Meanwhile, two-thirds (65%) of households affected by disability or health issues experienced disproportionately high levels of food insecurity. This was significantly higher than households not affected by disability or health issues (28%).

“I am the sole income earner for my family, which includes my partner and our toddler. I work full-time across two jobs to support us. My partner is on the Disability Support Pension but, due to my income, only receives around $100 per fortnight. Living on a single income while supporting a family has become extremely difficult.”
For First Nations households, food insecurity remains significantly above the national average. In 2026, 57% of these households experienced food insecurity, including 40% experiencing severe food insecurity.
Notably, in a trend also seen in the data from 2025, food insecurity was significantly higher among households with children than households without in 2026 – at 45% compared with 28% respectively. Within the same cohort, single-parent households experienced particularly high levels of food insecurity, with 60% affected. Of these, nearly two in five (or 38%) reported experiencing severe food insecurity.
Food insecurity was most prevalent among younger households in 2026, affecting almost half (48%) of those represented by Australians aged 18 to 34. More than one in four (28%) experienced severe food insecurity.
Food insecurity rates were lower among households represented by Australians aged 35 to 54 (37%) and those aged 55 and over (19%), although severe food insecurity still affected almost a quarter (23%) of households in the 35 to 54 age group and more than one in ten (11%) older households.
Food insecurity was significantly more prevalent in regional Australia than in metropolitan areas, affecting 36% of regional households compared with 32% of metropolitan households. Severe food insecurity was particularly acute in regional communities, impacting almost one in four households (23%), significantly higher than the rate recorded in metropolitan areas (18%).
Employment-related pressures are also intensifying. The proportion of food insecure households reporting difficulty finding work as a contributing factor increased significantly from 11% in 2025 to 15% in 2026, while the proportion citing job loss rose from 10% to 13%. These findings highlight the growing role of labour market challenges in driving household food insecurity alongside ongoing cost-of-living pressures.
These are not marginal differences. They represent profound inequalities in Australia’s ability to meet one of life’s most basic needs.
The new face
of hunger
For generations, hunger was largely associated with chronic disadvantage. That is no longer the case. Nearly seven in ten (69%) food insecure households first experienced food insecurity within the past year. Many are working households, families raising children and people who have never previously sought assistance.
Meet a few of these people
Show more…The profile of hunger in Australia is changing. Hunger is no longer confined to society’s margins. It is moving into the mainstream.
Leila’s story
For Leila, life has been a balancing act over the past year.
But when her husband injured his leg four months ago and was unable to work, everything changed. Leila, still breastfeeding her youngest, had already been struggling on a single income, but her husband’s accident meant she no longer had access to even that. “I tried shopping around between supermarkets, but we just weren’t managing,” Leila shared.
Rising grocery costs and limited options made even the basics feel out of reach. That’s when a family friend introduced her to Foodbank.
Getting a referral was a turning point. “It’s helped me so much. Especially the free fruit and vegetables, bread and all the other bits and pieces,” Leila said.
The cost-of-living crisis has hit hard, especially when it comes to meat. “Prices have gone up so much, and we only eat Halal meat, which is more expensive at supermarkets.”
Even simple things like fresh fruit have become a luxury. “An apple used to be cheap, but now it’s so expensive. I want to see my kids eat what other kids eat and not be left out.”
Families like Leila’s are struggling to afford even the basics. Foodbank is bridging the gap, but demand is soaring. Every apple, loaf and box of cereal provides more than food; it offers hope.

“I sent them, [the kids], over to a friend’s house for a catch up, knowing nibbles and the like would be offered, so no stigma attached.”
When hunger becomes chronic
Receipt of government benefit payments was associated with substantially higher levels of food insecurity in 2026. Food insecurity affected 41% of households represented by respondents receiving government benefits, including 27% experiencing severe food insecurity. These findings highlight the ongoing food security challenges faced by households reliant on income support and echo the findings of the ACOSS Poverty in Australia 2026: Who is Affected report, which found three in four people in households relying on Jobseeker and Youth Allowance were below the poverty line.
Food insecurity also remained disproportionately high among households with part-time or casual workers, affecting 42% in 2026 compared with 33% of Australian households nationally. This suggests that insecure forms of employment continue to leave many households vulnerable to financial strain and difficulty accessing adequate food.
Financial pressure
reshaping everyday life
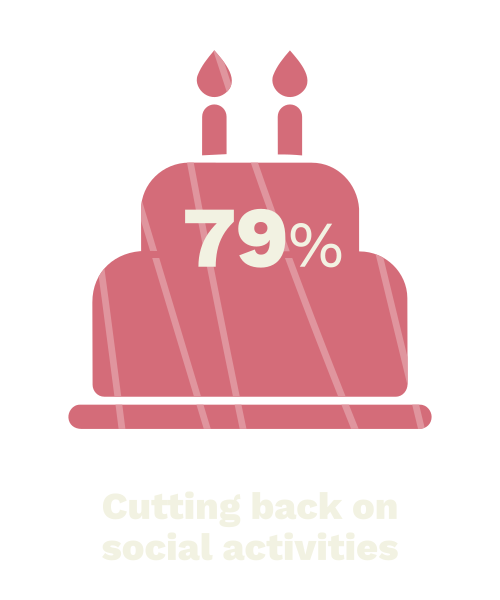
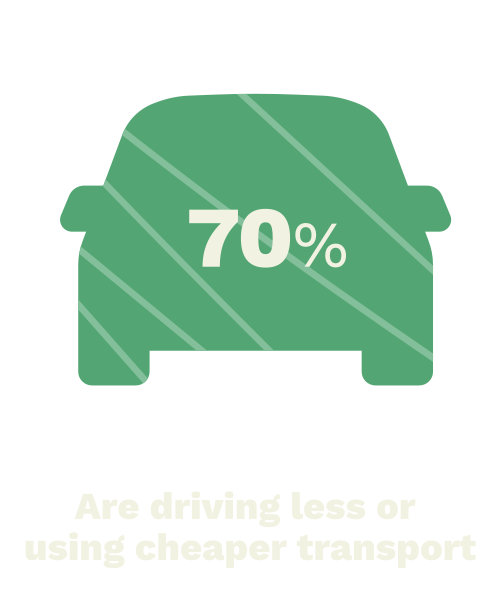
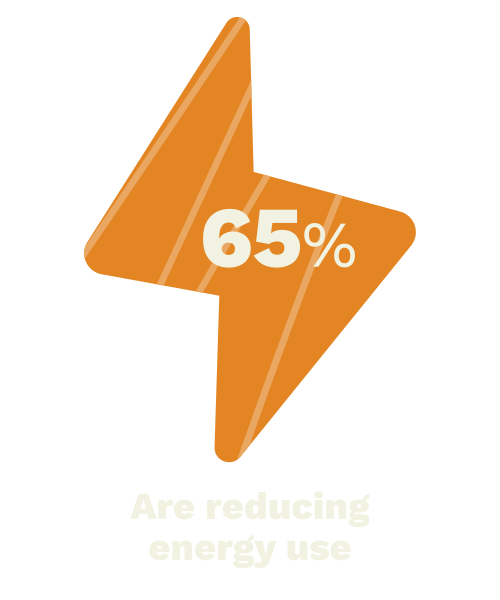
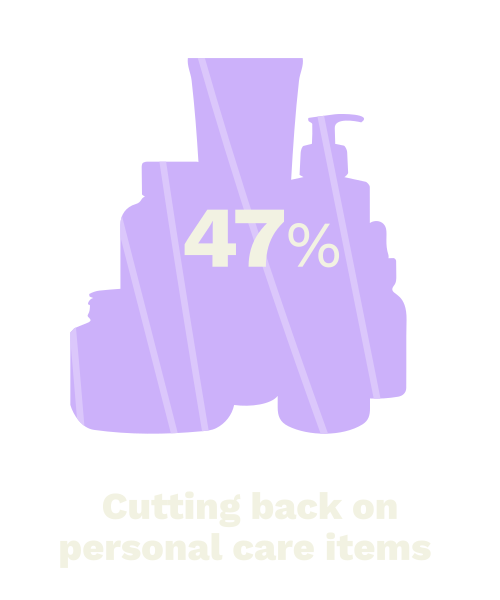
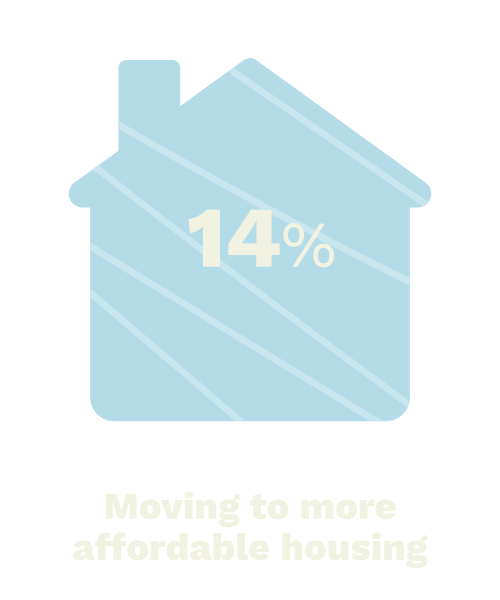
Food insecurity affects every aspect of daily life. Households are adapting to cost-of-living pressures as their coping behaviours evolve. These measures include driving less or relying on cheaper transport, reducing energy use, cancelling social activities, cutting back on personal care items and moving to more affordable housing.
Go deeper on the numbers
Show more…“We made sure the kids ALWAYS eat even if it’s just spaghetti bolognaise. We can survive on bread and butter.”

Concerningly, families are not trimming luxuries; they are surrendering essentials and withdrawing from everyday life simply to keep food on the table. The consequences extend well beyond food.
Thinking of the last 12 months, which, if any, of the following have you used to manage the cost of living for yourself and/or your household?
| Food secure households | Food insecure households | |
|---|---|---|
| Drove less or used cheaper alternatives (e.g. cycling, public transport) | 41% | 70% |
| Cut back on paid personal care/grooming services (e.g. haircuts/barber, salon, nails, beauty treatments) | 32% | 66% |
| Looked for sales/discounts on food and grocery items | 49% | 66% |
| Reduced home energy use (e.g. cutting back on heating or cooling) | 39% | 65% |
| Cut back on taking part in social events and celebrations (e.g. birthdays, anniversaries, cultural/religious holidays) | 31% | 65% |
| Cut back on eating/drinking in restaurants, cafes and bars | 42% | 61% |
| Swapped food for cheaper alternatives (e.g. frozen/tinned instead of fresh food, buying imperfect food) | 25% | 56% |
| Cut back on hosting social events and celebrations (e.g. birthdays, anniversaries, cultural/religious holidays) | 26% | 51% |
| Portioned meals and/or ingredients to reduce food waste | 21% | 50% |
| Cut back on other household supermarket items (e.g. aluminium foil, plastic wrap, trash bags, food storage bags, and light bulbs) | 17% | 49% |
| Cut back on cleaning or personal care products (e.g. detergent, cleaning sprays, soap, shampoo, toothpaste) | 14% | 47% |
| Planned meals ahead of time (e.g. planning lunch, dinner and/or snacks on a weekly basis) | 35% | 47% |
| Dipped into personal/household savings | 25% | 45% |
| Cut back on other food and grocery items (e.g. oils, sauces/dressings, condiments, cereals, soups, canned goods) | 13% | 42% |
| Cut back on paid fitness or sport activities (e.g. gym memberships, exercise classes, team/club fees) | 18% | 40% |
| Reduced purchasing of fresh produce (e.g. fruits, vegetables) | 8% | 38% |
| Reduced purchasing of protein (e.g. meat, fish, plant-based protein) | 10% | 37% |
| Deferred payment by spending more on credit cards or Buy-Now-Pay-Later apps | 8% | 29% |
| Bought food and groceries in bulk | 21% | 28% |
| Reduced purchasing of dairy products (e.g. milk, cheese, yoghurt, butter) | 5% | 28% |
| Switched energy plans or providers | 16% | 20% |
| Grown fresh produce at home (e.g. herbs, fruits, vegetables) | 14% | 19% |
| Moved to lower-cost accommodation | 3% | 14% |
| Refinanced loans | 3% | 9% |
| Other ways to manage | 5% | 7% |
| No, I haven’t had to change anything to manage the cost-of-living for myself/our household | 22% | 4% |
Filter: 2026; Weight: Final_hhld_wt; base n = 5880; effective sample size = 3729 (63%); 74% filtered out
“I found a different grocery store that sold cheaper food. Also cut back on social events because social events would cost money most of the time. Sold a couple of my possessions like my watch and my scooter.”
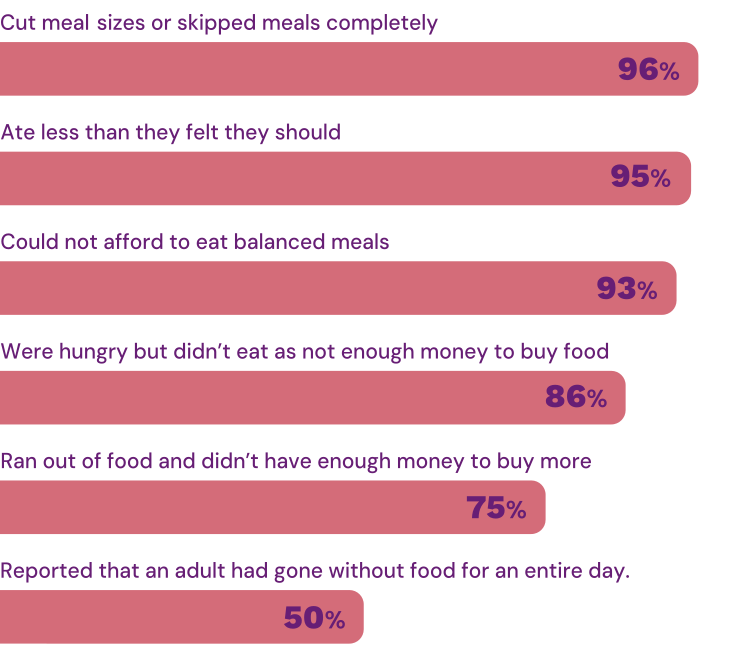
For households experiencing severe food insecurity, 97% worried that food would run out before they could afford more. Many regularly skip meals, eat less than they need, forgo balanced nutrition and spend entire days without eating because they cannot afford food.
Households that are severely food insecure 2026
“I cut down on my expenses, drive less with my vehicle and turn off electricity to reduce bills.”
“(We) went without, which is sad, as we are struggling pensioners unable to make ends meet at this stage of our lives.”
“We couldn’t afford to purchase food till next pension but we did have 4 pieces of bread and vegemite, so we had that.”
“(I) carefully ration my food out and go hungry when it does not go far enough. I go hungry in preference to eating poor quality sugary and highly processed food for health reasons.”

The hidden cost of hunger: shame and stigma
One of the most troubling findings in this year’s report is that many Australians continue to struggle alone.
Show more…“I am unable to afford increased rent, specialist fees for my daughter, her medications and food. I have been forced to attend a foodbank in the past few months to get food for my daughter and me.”
While food insecurity is widespread, shame remains one of the greatest barriers to seeking support. Nearly half (48%) of food insecure households report embarrassment as a reason for not accessing assistance and only half know where help is available. 26% received assistance from a formal organisation in the past year while informal support from family and friends increased from 25% to 29%.
Hunger often remains hidden because those experiencing it fear judgement. The result is that people wait until circumstances become critical before seeking support.
Reducing hunger requires more than providing food; it requires creating systems of support that are visible, accessible and free from stigma.
“I’d rather go hungry”
“I’d have to be dying from hunger”
“There is deep shame”
“I wouldn’t ask for assistance”
School Breakfast Programs:
Support that works
As the largest provider of School Breakfast Programs in the country, Foodbank is pleased to see these programs continue to expand, demonstrating what effective, inclusive support can achieve.
Participation in School Breakfast Program by household food security level
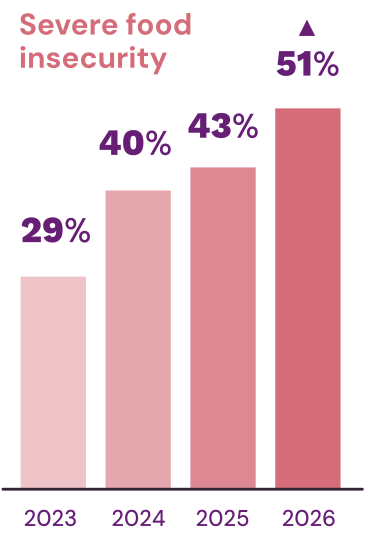
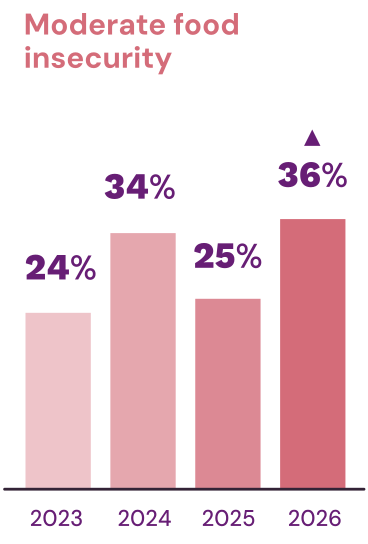
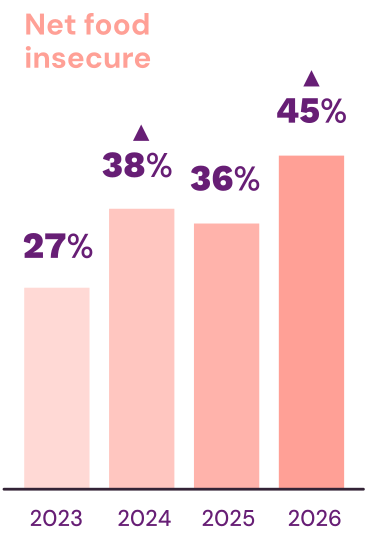
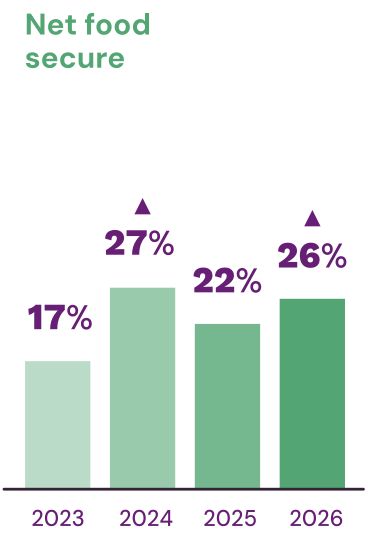
▲▼ Represents a significant change when comparing results from the previous year. (Base 2023 n=790; 2024 n=940; 2025 n=913; 2026 n=1,243).
Show more…Encouragingly, participation in School Breakfast Programs among food insecure households with school-aged children increased significantly, rising from 36% to 45%. Participation was highest among households experiencing severe food insecurity, with more than half (51%) accessing programs. Uptake also increased among moderately food insecure households, climbing from 25% to 36%.
Meanwhile, the proportion of non-participating, food insecure households, who believed other children needed the support more, fell significantly from 27% to 14%.

The increase in School Breakfast Program participation among food insecure households provides compelling evidence that investment in preventative food security initiatives can deliver significant social returns. When practical support is available, accessible and free from stigma, families engage with it.
Foodbank’s experience shows that these programs do more than provide a meal. They improve attendance, concentration, classroom participation and family wellbeing, while helping to alleviate the immediate impacts of food insecurity. The findings underscore the need for continued and expanded investment in school-based nutrition programs to ensure that every child has the opportunity to learn and thrive, regardless of their family’s financial circumstances.
School Breakfast Program awareness, availability and participation among Australian households with children of school age
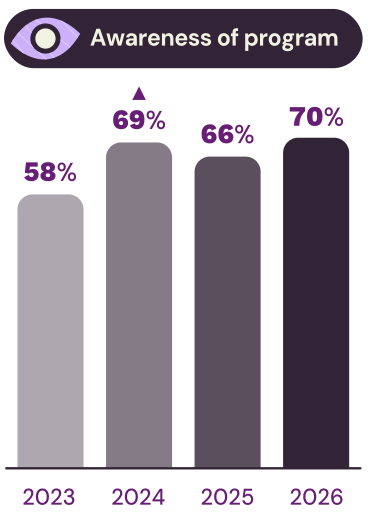
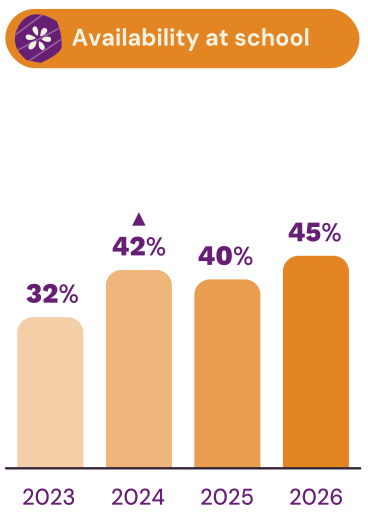
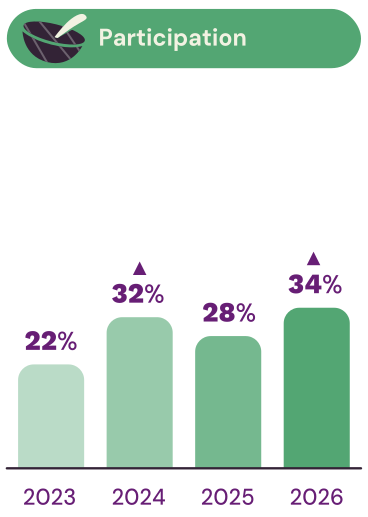
▲▼ Represents a significant change when comparing with previous year. (Base 2023 n=790; 2024 n=940; 2025 n=913; 2026 n=1,243).

“Students not only are appreciative of the food available but are racing to school for the opportunity to help serve breakfast to their fellow classmates. This has been a great, unexpected incentive to help bring students to school on time.”
School Breakfast Program in the Northern Territory

“The educators have noticed an increase in children accessing the program due to family affordability and working demands.”
School Breakfast Program in South Australia
What Australia
must do next
Food insecurity has become something we have unfortunately become used to.
It is the result of policy choices, economic conditions and societal priorities, however it can be reduced through collective action and sustained investment. Food relief organisations are providing essential support, but they cannot meet rising demand alone.
We can meaningfully reduce food insecurity
Show more…
To meaningfully reduce food insecurity, Australia must:
-
1. Set a national baseline for School Breakfast Programs
Establish a national minimum standard for school breakfast programs, ensuring every Australian child has access to a nutritious breakfast at school by 2030.
-
2. Increase investment in food relief
Ensure food relief organisations have the resources required to meet growing demand and respond rapidly during periods of heightened economic hardship.
-
3. Improve access to food relief
Increase awareness, availability and accessibility of support services, particularly in regional Australia.
-
4. Address income inadequacy
Strengthen the financial safety net to ensure social security payments and household incomes better reflect the true cost of living.
-
5. Support renters and vulnerable households
Develop targeted measures for renters, low-income households, people living with disability and other groups facing disproportionate risk.
-
6. Reduce stigma
Create a national conversation that normalises seeking assistance and recognises that food insecurity can affect anyone.
-
7. Treat food security as a national priority
Recognise access to adequate food as a foundational social and economic issue that affects health, education, productivity and community wellbeing.
-
8. Make it as easy as possible for producers and manufacturers to supply surplus produce to charities for redistribution
Introduce incentives that help farmers and manufacturers donate surplus produce and support food relief organisations to recover it.
Australia has the resources, the knowledge and the capability to address hunger. What is needed now is collective determination.
In a country as prosperous as ours, one in three households experiencing food insecurity should never be accepted as normal.
Methodology
The details…The Foodbank Hunger Report 2026 research was conducted between 9th July – 4th August 2026, through an online survey of 4,000 Australians aged 18 years or older (main sample) and a booster of 1,880 Australians aged 18 years or older from TAS (n=470), NT (n=110), WA (n=700) and SA (n=600). The main sample was nationally representative with interlocking quotas by age, gender and location.
The data was weighted to nationally representative proportions of age, gender, state and location as summarised in Table 1 below. The detailed methodology can be found on Foodbank’s website.
All 5,880 Australians answered the core HFSSM for measurement of the prevalence of household food security over the past 12 months. A total of 1,797 respondents (33%) were identified through the HFSSM as being from moderately and severely food insecure households. This group continued to answer a deep dive module about their experience living with food insecurity over the last 12 months.
| Sample size (n=5,880) | Total weighted (%) | ||
|---|---|---|---|
| Gender | Male | 2,679 | 46% |
| Female | 3,201 | 54% | |
| Age | 18–24 | 547 | 9% |
| 25–44 | 2,047 | 35% | |
| 45–54 | 923 | 16% | |
| 55–74 | 1,758 | 30% | |
| 75 or above | 605 | 10% | |
| State | NSW | 1,257 | 31% |
| VIC | 1,035 | 26% | |
| QLD | 812 | 20% | |
| SA | 281 | 7% | |
| WA | 428 | 11% | |
| TAS | 276 | 2% | |
| NT | 102 | 1% | |
| ACT | 69 | 2% | |
| Location | Capital city | 4,125 | 70% |
| Rest of state/territory | 1,755 | 30% | |
| Remoteness area | Major cities of Australia | 3,680 | 63% |
| Inner regional Australia | 1,714 | 29% | |
| Outer regional Australia | 394 | 7% | |
| Remote Australia | 73 | 1% | |
| Very remote Australia | 10 | 0% | |
Frequently Asked Questions
Show more…General Overview
33% of Australian households experienced food insecurity in the past 12 months. Of these, 61% are severely food insecure, meaning they frequently skip meals or go entire days without eating.
No. Food insecurity level has remained the same as 2025 due to sustained cost-of-living pressures caused by the volatile international environment’s impact on energy costs and inflation. In 2026, 100,000 more households were impacted by food insecurity than in 2025.
Cost-of-living pressures remain the dominant driver. 88% of Australians cite it as one of their top three concerns, and for food insecure households it’s 92%. International volatility, unemployment, inflation, interest rate rises and housing unaffordability continue to put immense pressure on households.
The housing affordability crisis is now directly feeding food insecurity. More than half (51%) of renters are food insecure.
Australians living with disability or ill health are disproportionately impacted — 65% of these households experience food insecurity, and nearly three quarters experience it severely. Households with children, low-income households, and households represented by Aboriginal and Torres Strait Islander respondents also face extreme hardship.
Yes. Awareness has broadly maintained 2025’s gain, currently at 52% in 2026.
Stigma remains the biggest barrier when it comes to seeking help. 48% of food insecure households say they feel embarrassed or ashamed to ask for help. This becomes more acute for
severely food insecure households with 51% citing embarrassment and shame as a barrier.
Yes. Participation in school breakfast programs among food insecure households has increased significantly, rising to 45%, from 36% the previous year.
About the Foodbank Hunger Report
The Hunger Report is Foodbank Australia’s annual publication that provides a comprehensive picture of food insecurity across the nation.
Foodbank Australia has been doing the Report for 14 years. It started as a simple survey of food relief charities asking them about their observations regarding the levels of those seeking food relief. Each year we’ve sought to improve the report so that now it is a best practice in terms of measuring the level of food insecurity using the USDA (United States Department of Agriculture) Household Food Security Survey Module (HFSSM) which is the global gold standard. Due to the evolution of the survey, we have 5 years of trend data regarding the level of food insecurity in Australia.
To raise awareness, inform evidence-based policy, and ensure the voices of people experiencing food insecurity are heard.
The Foodbank Hunger Report uses the 18-item USDA HFSSM. This is the full standard tool used to measure household food security in the U.S. and internationally. It is the most comprehensive version of the USDA’s survey modules. The HFSSM uses a point allocation system based on respondent’s answers to classify households according to the Food Security Spectrum.
For more detailed information, please visit: https://www.ers.usda.gov/topics/food-nutrition-assistance/food-security-in-the-us
The USDA defines food security in four levels based on responses to the HFSSM.
| Status | Level of impact | Label as per HFSSM | Definition |
|---|---|---|---|
| Food Secure | Highly food secure | High food security | No reported indications of food-access problems or limitations. |
| Marginally food secure | Marginal food security | One or two reported indications—typically of anxiety over food sufficiency or shortage of food in the house. Little or no indication of changes in diets or food intake. | |
| Food Insecure | Moderately food insecure | Low food security | Reports of reduced quality, variety or desirability of diet. Little or no indication of reduced food intake. |
| Severely food insecure | Very low food security | Reports of multiple indications of disrupted eating patterns and reduced food intake. |
The USDA defines food insecurity as “the limited or uncertain availability of nutritionally adequate and safe foods or limited or uncertain ability to acquire acceptable foods in socially acceptable ways”. In other terms, food insecurity is the situation where a household lacks reliable access to sufficient, safe, nutritious, and culturally appropriate food to meet dietary needs and maintain an active, healthy life.
Source: https://www.ers.usda.gov/topics/food-nutrition-assistance/food-security-in-the-us/measurement
In September 2025, the ABS released the 2023 NNPAS results, which included a new measure for estimating levels of food insecurity in Australia. These results indicated that 13.2% of Australian households experienced food insecurity in 2023. This differs from the Foodbank Hunger Report’s 2023 results which showed food insecurity at 36%.
The findings of the ABS National Nutrition and Physical Activity Survey (NNPAS) not only differ from the Foodbank Hunger Report Survey, but from most other studies conducted in Australia. An example of this would be the International Food Policy Study (IFPS), a global benchmark for this type of research by the University of Waterloo, which shows similar findings to Foodbank’s Hunger Report Survey.
There are several likely reasons for these differences:
- Survey mode
- Survey length
- Sampling methods
- The specific HFSSM module used
- The classification rules for food insecurity used
How a survey is conducted can have major impacts on the results it produces. In-person interviews — like those used for the NNPAS — have some advantages. They are good for obtaining a high response rate for very long surveys (as is the case for the NNPAS). However, they can create social desirability bias — which is the phenomenon where respondents often provide answers, they believe are socially acceptable and avoid providing the “wrong” answer — which is likely to be a larger problem for face-to-face surveys. With the inability to feed oneself or one’s family having a large potential for social stigma, it is likely social desirability bias has impacted on results.
Another high impact factor is the length of the survey. The Foodbank Hunger Report Survey is purposely designed to average no more than 15 minutes for respondents to complete. The NNPAS, however, looks to be an approximately 40-minute survey. Depending on where in the survey the food insecurity items are located, respondents may have spent considerable time already answering questions, leading to fatigue and increasingly poor-quality answers.